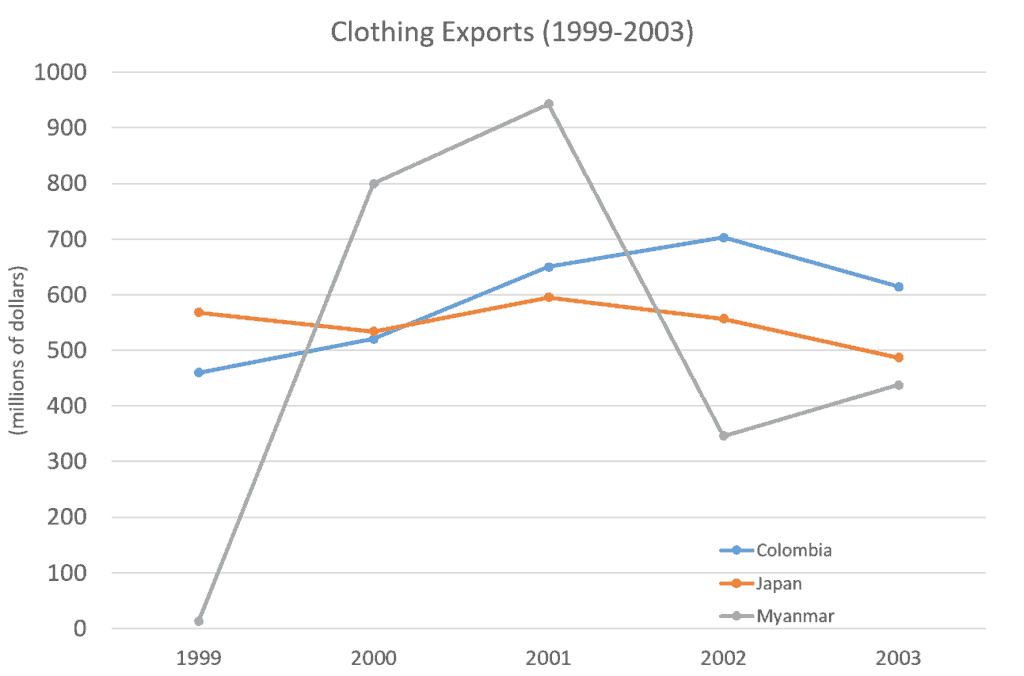
In today’s post I’m going to write an introduction and overview for last week’s line chart question. In next week’s post, we’ll look at how to divide the body paragraphs.
Do you remember the basic structure for Task 1 writing? In the introduction, we paraphrase the topic. And in the overview, we highlight the main features of the graph (the big picture).
Here’s the question:
The graph below gives information on the differences in clothing exports from three different countries.
Summarise the information by selecting and reporting the main features, and make comparisons where relevant.
Write at least 150 words.

Introduction:
The line graph compares the amount of clothing exported by three countries from 1999 to 2003.
Overview:
Overall, clothing exports from both Colombia and Myanmar had increased from their initial values by the end of the period shown. Japanese clothing exports, on the other hand, had slightly declined. Interestingly, Colombian and Japanese exports showed relatively small fluctuations from 1999-2003 whereas exports from Myanmar were extremely volatile.
IELTS Master Comments: The introduction above is quiet simple, but includes words that are not a part of the question. The overview is slightly more complicated and uses some advanced grammar and vocabulary. Do you see anything here that you didn’t know before?
The introduction part is too short. It is simply the paraphrase of the question.
Thanks for the comment! I think that the detail in the overview makes up for the brevity of the introduction.
??? r u kiddin’ bro! the intro part is 4 paraphrases
The given chart shows how clothing exports from three countries varies. The three countries given are Colombia, Japan and Myanmar. The information on clothing export over the period of five consecutive years from 1999 to 2003 is represented as in following lines.
Myanmar’s export of clothing has shown lot of flactuation over the period. In the first year, it had increased exponentially, which progressed further in the following year but at reduced pace. However, 2001 onward, it dropped and reached the lowest possible. Although, it improved in the following year, it never picked up the pace of the first two years. The export value has increased from few million dollars in 1999 to over 400 million dollars by the year 2003.
Colombia’s export of clothing too had shown some flactuation but at relatively lower rate. There was growth in export but with irregular rise and fall in values over the period. From about 450 million dollars in 1999 the value rose to around 600 million dollars in 2003.
Japan’s export is the least fluctuated one in the given graph. Unlike for other two countries the value of the export had reduced from around 600 million dollars in 1999 to less than 500 million dollars in the year 2003.
Overall, the information on the graph is positive for Myanmar and Colombia but is regressive for Japan. Export value for the two former countries have increased over the period but had dropped in the case of the latter.
I have checked your blog and i have found some duplicate content, that’s why
you don’t rank high in google’s search results, but there is a
tool that can help you to create 100% unique content, search for; SSundee advices unlimited content for your blog