Today I’m going to show you my detail paragraphs for the IELTS line chart question. If you want to read the introduction and overview, click here.
Take care to notice 1) how I divided the paragraphs, and 2) how I’m comparing the countries, not just describing the data.
Here’s the question:
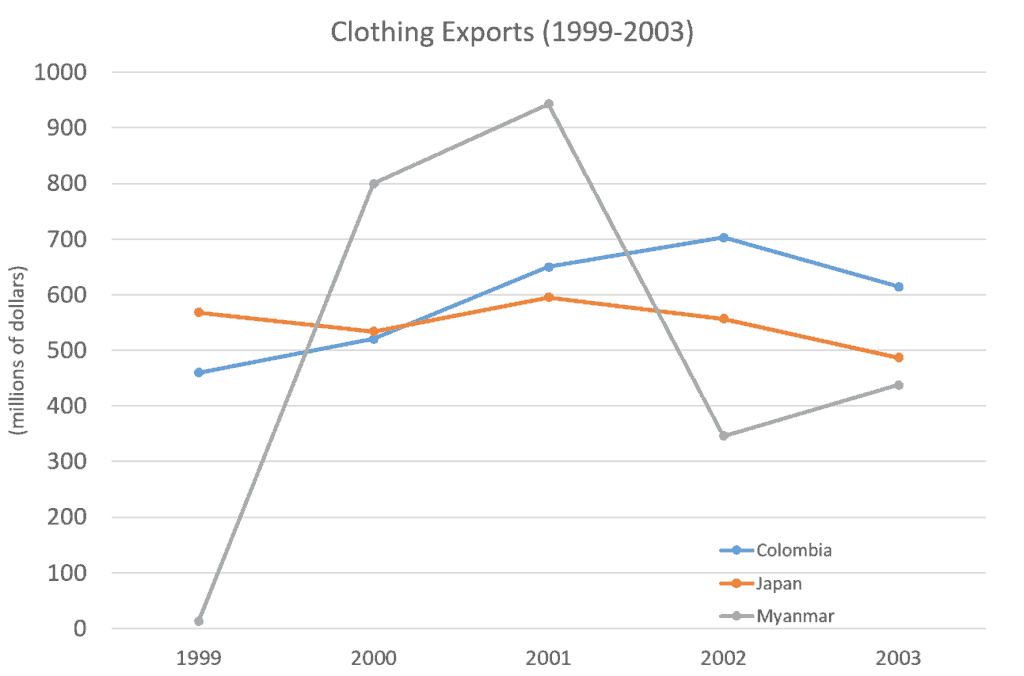
The graph below gives information on the differences in clothing exports from three different countries.
Summarise the information by selecting and reporting the main features, and make comparisons where relevant.
Write at least 150 words.

Body Paragraph 1 (1999-2000):
Looking in more detail, in 1999 Myanmar exported approximately 5 million dollars of clothing compared to about 450 million dollars for Colombia and 575 million for Japan. However, from 1999 to 2000 Myanmar clothing exports skyrocketed, surpassing both countries for a total of 800 million dollars’ worth. The relatively small gap between Japan and Colombia, on the other hand, narrowed even further with both countries exporting around 530 million dollars of clothes in 2000.
Body Paragraph 2 (2000-2003):
From 2000, Myanmar clothing exports continued to increase, reaching a peak value of 920 million dollars in 2001 before plummeting and then recovering slightly in 2003 for a final value of 400 million, the lowest among the three countries. Colombia, having surpassed Japan in the period from 2000 to 2001, ended up with the highest total exports in 2003 at 600 million dollars.
Full Sample Essay (Band 9):
The line graph compares the amount of clothing exported by three countries from 1999 to 2003.
Overall, clothing exports from both Colombia and Myanmar had increased from their initial values by the end of the period shown. Japanese clothing exports, on the other hand, had slightly declined. Interestingly, Colombian and Japanese exports showed relatively small fluctuations from 1999-2003 whereas exports from Myanmar were extremely volatile.
Looking in more detail, in 1999 Myanmar exported approximately 5 million dollars of clothing compared to about 450 million dollars for Colombia and 575 million for Japan. However, from 1999 to 2000 Myanmar clothing exports skyrocketed, surpassing both countries for a total of 800 million dollars’ worth. The relatively small gap between Japan and Colombia, on the other hand, narrowed even further with both countries exporting around 530 million dollars of clothes in 2000.
From 2000, Myanmar clothing exports continued to increase, reaching a peak value of 920 million dollars in 2001 before plummeting and then recovering slightly in 2003 for a final value of 400 million, the lowest among the three countries. Colombia, having surpassed Japan in the period from 2000 to 2001, ended up with the highest total exports in 2003 at 600 million dollars.
Your Homework: Try to write an answer for the question above.
The range of years in the last sentence of the last paragraph should have been from 2001 to 2003, right?
Thanks for your comment!
The years in the last paragraph are correct as is. If you look at the graph, you can see that the two countries switched places at some point between 2000 and 2001.
I did edit the last paragraph slightly to make it clearer.
D line graph which u xpanded is more than 200 words ? Is dat ok to write 200 words??
Yes, as long as it’s over 150 words, it’s ok.
The graph show from 2001 to 2003, Japan had slightly declined. But your paragraph 4 didn’t mentioned about Japan export with numbers. Is it ok to replace about Japan export with Colombia export to inform as a whole?
Cheers.
no, I think that we must write task 1 no more than 180 words. between 150 and 180
“Looking in more detail, in 1999 Myanmar exported approximately 5 million dollars of clothing compared to about 450 million dollars for Colombia and 575 million for Japan.”
Why the data of exported clothing in Myanmar in 1999 is approximately 5 million dollars? Thanks!