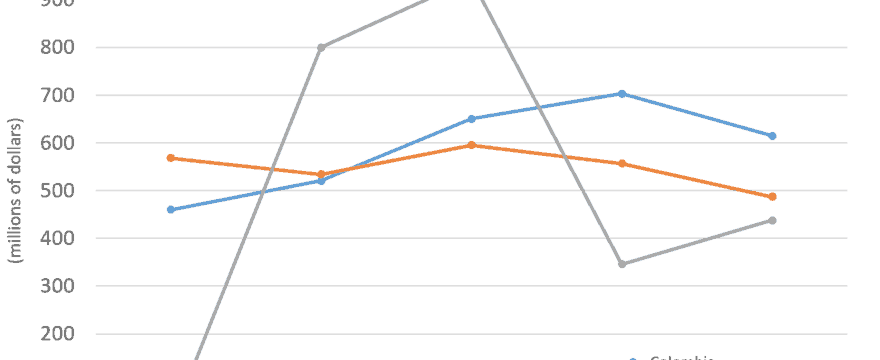
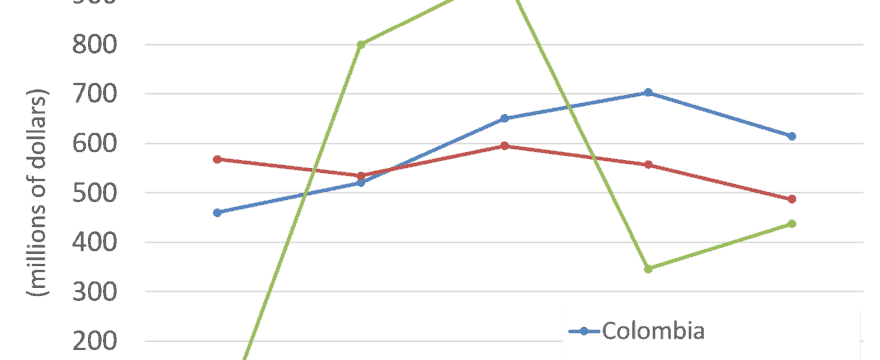
Today I’m going to show you my detail paragraphs for the IELTS line chart question. If you want to read the introduction and overview, click here. Take care to notice 1) how I divided the paragraphs, and 2) how I’m comparing the countries, not just describing the data. Here’s the question: The graph below gives information on the differences […]
IELTS Writing Task 1: Line Chart Introduction and Overview
In today’s post I’m going to write an introduction and overview for last week’s line chart question. In next week’s post, we’ll look at how to divide the body paragraphs. Do you remember the basic structure for Task 1 writing? In the introduction, we paraphrase the topic. And in the overview, we highlight the main features […]
IELTS Writing Task 1: “Clothing Exports” Line Chart
For today’s practice, writing a report for about the following information. Next week I’ll give you some tips and show you part of my answer. The graph below gives information on the differences in clothing exports from three different countries. Summarise the information by selecting and reporting the main features, and make comparisons where relevant. Write […]
IELTS Writing Task 1: Basic Structure
The basic paragraph structure of Task 1 writing is quite simple: Introduction: Explain in your own words what the graph(s), table(s), or diagram(s) is showing Overview: In general terms, tell what main/interesting features are. Body 1/2: Explain these features in detail. If you have numbers, this is a good place to include them. Use two body paragraphs […]
IELTS Writing Task 1: Two-sided Bar Chart Detail Paragraphs (with Full Example Essay)
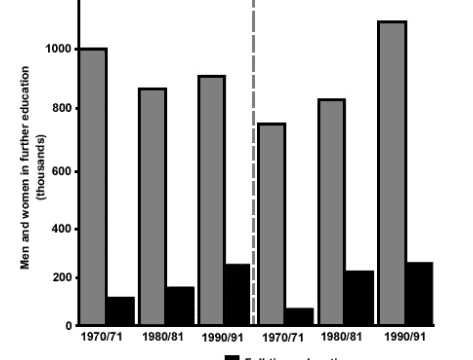
In last week’s post I gave a sample introduction and overview for this IELTS Task 1 Two-Sided Bar Chart. This week you can see my detail paragraphs. The Two Detail Paragraphs: Detail Paragraph 1: In regards to part-time education, male enrolment started in the 1970 school year at 1 million before dipping to around 850 thousand in […]
IELTS Writing Task 1: Two-sided Bar Chart
In this article I’ll show you how to write the introduction and overview for a two-sided bar chart. Next week I’ll include the “detail” paragraphs. The chart below shows the number of men and women in further education in Britain in three periods and whether they were studying full-time or part-time. Introduction The bar chart […]


