In this article I’ll show you how to write the introduction and overview for a two-sided bar chart. Next week I’ll include the “detail” paragraphs.
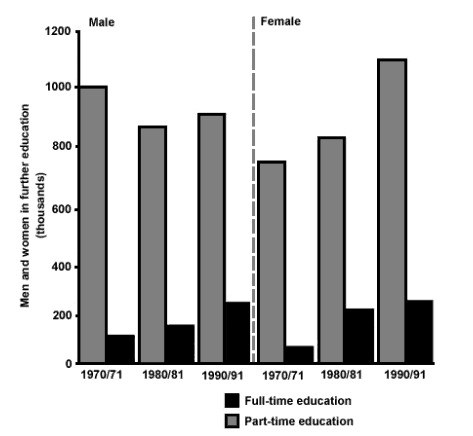
| The chart below shows the number of men and women in further education in Britain in three periods and whether they were studying full-time or part-time. |
Introduction
The bar chart compares the enrollment of men and women into full-time and part-time British further education programs in the 1970, 1980, and 1990 school years.
Overview
Overall, part-time education was several times more popular than full-time education throughout the entire period. In addition, while initially men had larger enrollment numbers in both part-time and full-time programs than women, by the end of the period women had surpassed men in part-time study and matched them in full-time.
Credits: Thanks to IELTS Simon for the article style.
Leave a Reply