

In today’s post I’m going to write an introduction and overview for last week’s line chart question. In next week’s post, we’ll look at how to divide the body paragraphs.
Do you remember the basic structure for Task 1 writing? In the introduction, we paraphrase the topic. And in the overview, we highlight the main features of the graph (the big picture).
Here’s the question:
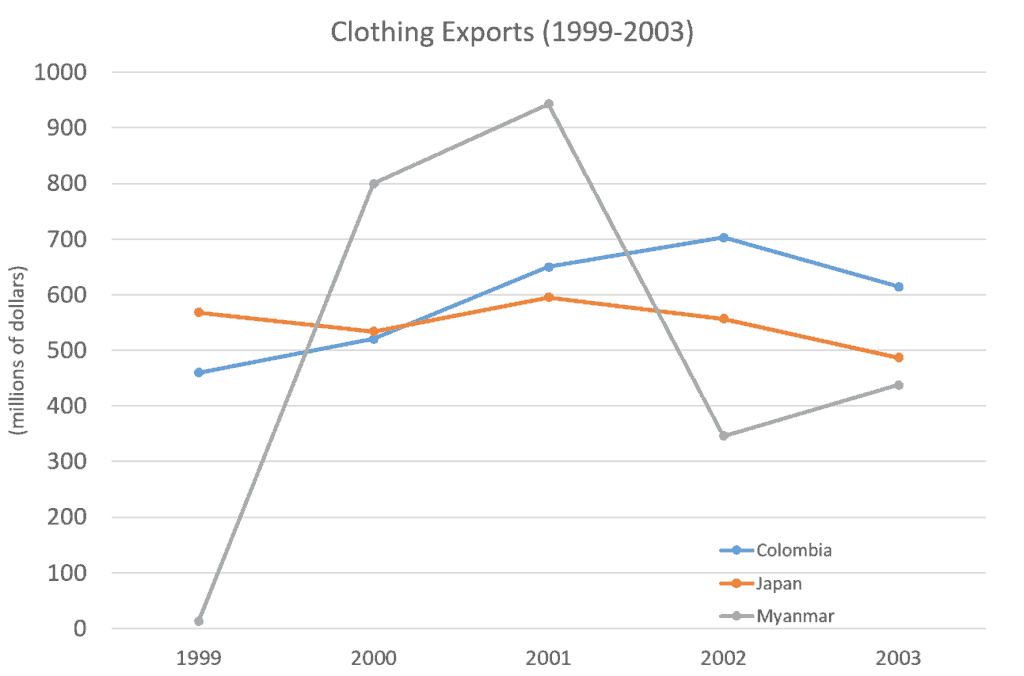
The graph below gives information on the differences in clothing exports from three different countries.
Summarise the information by selecting and reporting the main features, and make comparisons where relevant.
Write at least 150 words.

Introduction:
The line graph compares the amount of clothing exported by three countries from 1999 to 2003.
Overview:
Overall, clothing exports from both Colombia and Myanmar had increased from their initial values by the end of the period shown. Japanese clothing exports, on the other hand, had slightly declined. Interestingly, Colombian and Japanese exports showed relatively small fluctuations from 1999-2003 whereas exports from Myanmar were extremely volatile.
IELTS Master Comments: The introduction above is quiet simple, but includes words that are not a part of the question. The overview is slightly more complicated and uses some advanced grammar and vocabulary. Do you see anything here that you didn’t know before?