


The basic paragraph structure of Task 1 writing is quite simple:
- Introduction: Explain in your own words what the graph(s), table(s), or diagram(s) is showing
- Overview: In general terms, tell what main/interesting features are.
- Body 1/2: Explain these features in detail. If you have numbers, this is a good place to include them. Use two body paragraphs if you have two graphs/tables/diagrams.
Looking at this essay from before…can you see how it is divided into these three parts?
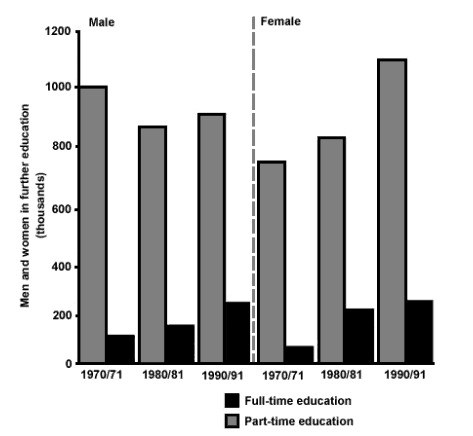
The bar chart compares the enrolment of men and women in full-time and part-time British further education programs in the 1970, 1980, and 1990 school years.
Overall, part-time education was several times more popular than full-time education throughout the entire period. In addition, while men had larger initial enrolment numbers in both part-time and full-time programs than women, by the end of the period women had surpassed men in part-time study and matched them in full-time.
In regards to part-time education, male enrolment started in the 1970 school year at one million before dipping by about 150,000 in the 1980 school year and then making a slight recovery to around 900 thousand students in 1990/91. In contrast, females started lower at about 775 thousand and rose steadily, finally surpassing males in the 1990 school year for a total of approximately 1,100,000.
The trend for full-time education was only slightly different. Female numbers again started lower in the 1970 school year at under 100,000 students but had already surpassed male totals by 1980. While male enrolments grew faster in the subsequent period, the final totals for both males and females in full-time education was more or less identical at around 220 thousand students in the 1990-91 school year.